Statistics Page
On Statistics tab on Applications Dashboard, you can check statistics of your applications and clusters by graphs.
Choosing a graph
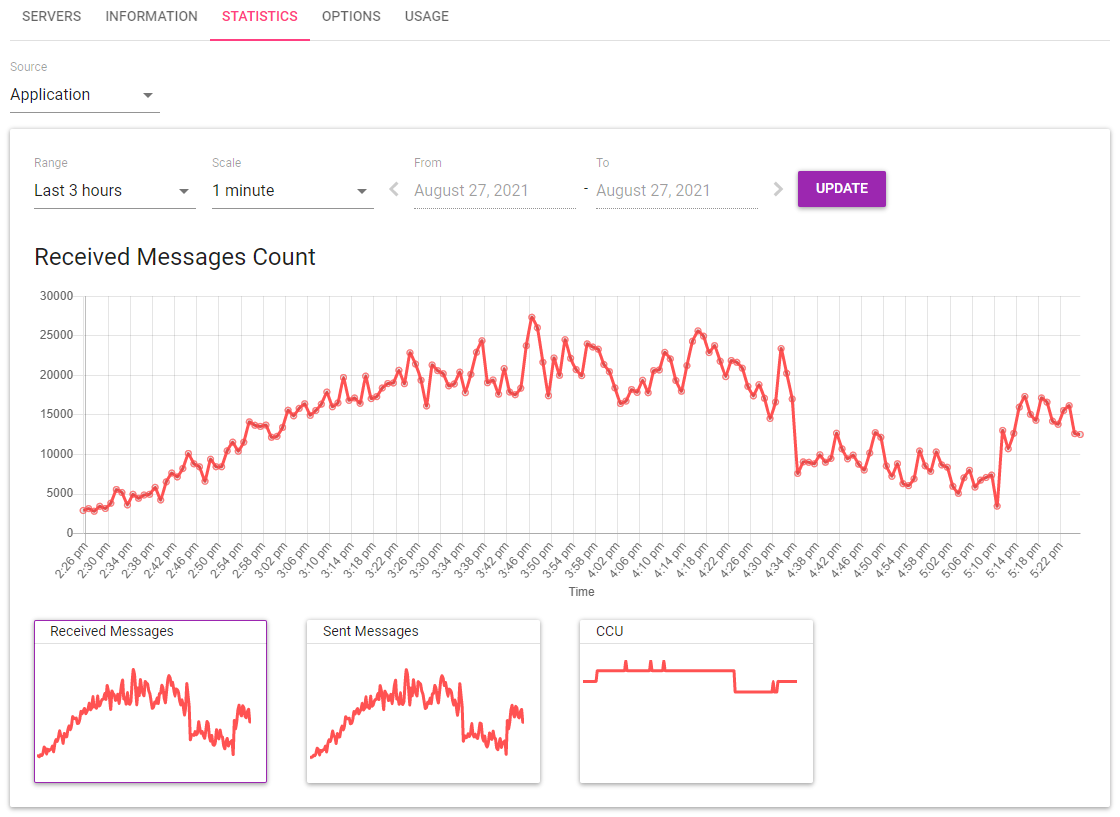
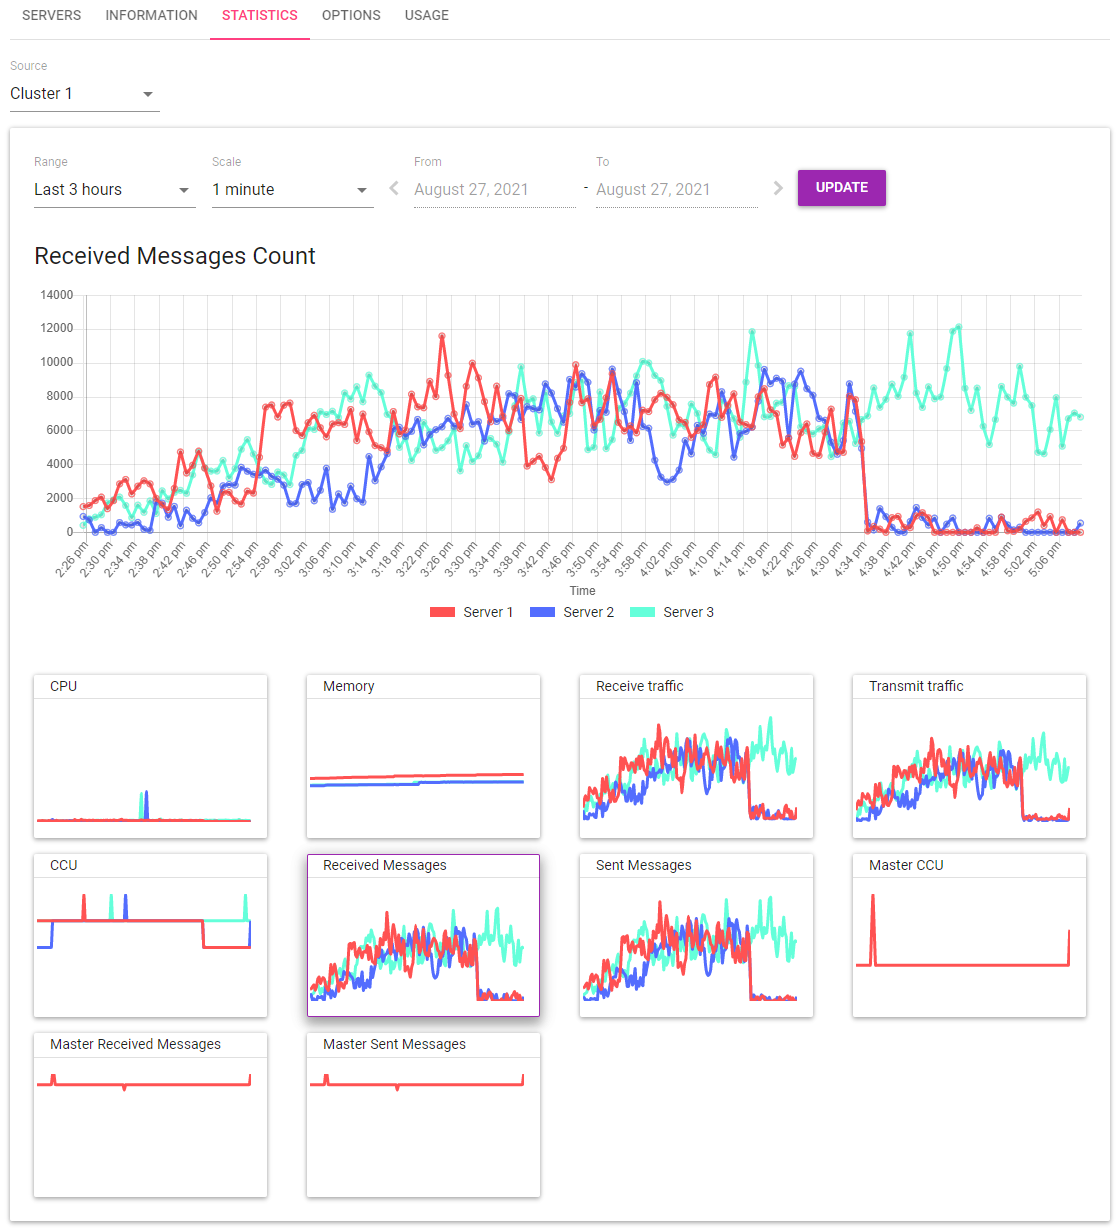
On top of the page is Source dropdown, which is set to Application as default. Graphs show the sum of all the clusters in the application under the default source. The dropdown includes cluster names, too. If you select a cluster name, graphs show detailed statistics for servers in that cluster only.
Clicking on one of the mini graphs listed on the lower part of the page switches the main graph. If Application is selected as Source, you can choose from the following three graphs:
If a cluster is selected as Source, seven more graphs become available, and you can choose from the following ten graphs:
When a cluster includes multiple server instances, each graph shows statistic values colored and layered by servers. (The last three graphs are for statistics data from master server only, and they are always single layered and single colored.) You can also turn the visibility of each server on and off by clicking on a legend below the horizontal axis.
Values on the graphs
Values on the graphs are explained in the following pages:
Display range
Above the main graph are items to specify the range of time to show on the graph. Specifying the range and clicking on Update will update the graph.
Range |
From the dropdown, choose the range of time graphs should cover. You can choose the range by number of days or hours to see the recent records, or you can specify any range of days after choosing Custom. |
Scale |
From the dropdown, choose the scale of the plotting interval. Changing the Range and clicking on Update will change the available Scale options. |
From |
The first day in the range to show. If you choose Custom in Range, clicking on this field shows a calendar so that you can select a day. |
To |
The last day in the range to show. If you choose Custom in Range, clicking on this field shows a calendar so that you can select a day. |
Note
You can show past graphs for certain amounts of time, but the old data may be deleted due to storage limitations or other reasons. Please keep screenshots if you want to make sure you can refer to past graphs.